
DNA’s Statistics: How Different Age Groups in Finland’s 50 Largest Municipalities Use Mobile Phones
20.11.2025 10:30:00 EET | DNA Oyj | Press release
Finns consume mobile data at record levels, and for example, the average mobile internet use among young people already allows for hours of video viewing daily. DNA’s comparison of the 50 largest municipalities between January and October 2025 reveals surprising differences between municipalities and age groups in the amount of data used on phones. On average, Rovaniemi tops the list. Check the full statistics at the end of the release.
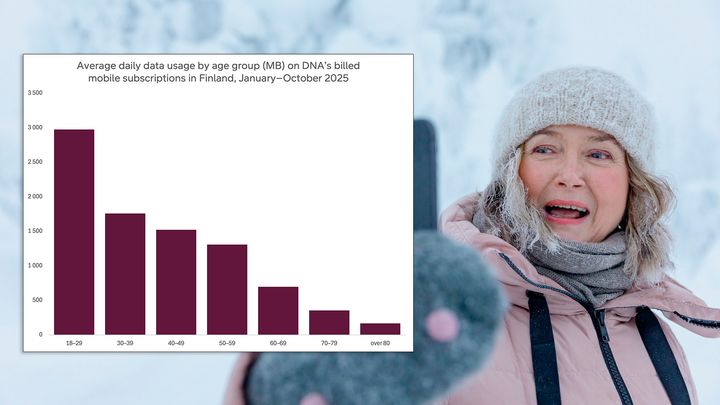
Young adults remain heavy users of mobile internet. People aged 18–29 use clearly the most mobile data in all municipalities, but older age groups have caught up: for example, those aged 50–59 already consume more than 1,000 MB of data per day in all municipalities examined. Nationwide, 18–29-year-olds use an average of 2,975 MB per day, those in their thirties 1,758 MB, forties 1,523 MB, and fifties 1,309 MB. Data usage drops significantly among people in their sixties, seventies, and eighties.
“If we look back a couple of years, the relative differences have narrowed among people in their thirties, forties, and fifties as data volumes have grown. Users can now roughly be divided into three groups. Clearly in first place are young adults, who may still be studying or just starting their careers. The second group consists of working-age people around middle age. The third group, with much smaller mobile data volumes, are those approaching or already past retirement age,” summarizes Mikko Valtonen, DNA’s Vice President of Mobile Business.
However, there are significant differences between municipalities. For example, Raahe, Savonlinna, Kotka, Tornio, and Imatra are clearly at the top for young people’s data usage, with all exceeding 3,700 MB per day. Young residents of Kajaani, Riihimäki, Joensuu, Rovaniemi, Mikkeli, Kouvola, and Hämeenlinna also use considerably more data than the average across the 50 largest municipalities. In contrast, young people in Ylöjärvi, Vihti, Tuusula, Kangasala, and Sastamala fall below the national average.
“An interesting observation is that Finland’s overall average ranks at the bottom of the list of the 50 largest municipalities in every age group. This suggests that people in larger municipalities typically use more mobile data than the national average,” Valtonen notes.
Rovaniemi, Vantaa, and Tampere Lead – Several Possible Reasons for Municipal Differences
The top three municipalities in terms of mobile data usage among the 50 largest are Rovaniemi, Vantaa and Tampere. The least mobile internet is used in Hollola, Sastamala and Kokkola. According to DNA’s Valtonen, there is no single factor that explains the differences between municipalities. However, reasons can be found in factors such as long distances, availability of public transport, the age distribution of residents, or where their relatives and friends live.
“The age distribution of residents has a big impact. Young people use significantly more data than older people, so a relatively larger number of young people raises the municipality’s average data usage. Among students and young adults, it’s also common that they don’t have a fixed home internet connection at all, and everything is done via mobile phone or by sharing the phone’s internet to computers or other devices. The amount of public transport use also matters. If you spend your commute sitting on a bus or metro, you have much more time to browse your phone than behind the wheel of a car,” Valtonen explains.
“In addition, residents’ background factors play a role. People with relatives or friends in other countries may want to stay in touch with their loved ones far away through video calls. The same applies within Finland if loved ones live far away and are rarely seen otherwise. This increases mobile data consumption, as especially calls between different countries are often made over data networks using apps like WhatsApp or Signal,” Valtonen reflects.
Several Municipalities Stand Out
In many municipalities, certain age groups clearly differ from the average. For example, in Imatra and Raahe, people in their thirties use exceptionally large amounts of data. Among those in their forties, Raahe, Imatra, Tornio, and Rovaniemi stand out, while in Pirkkala, the same age group uses exceptionally little mobile internet. Among people in their fifties, no particular municipalities stand out for high usage, but Raisio shows exceptionally low usage. Among those in their sixties, variation is quite large, with Imatra, Rovaniemi, and Porvoo leading, while Kokkola and Seinäjoki show the lowest usage.
For people in their seventies, the top municipalities for mobile data usage are Rovaniemi, Mäntsälä, Riihimäki, Kerava, Helsinki, Nurmijärvi, and Imatra, while Raisio and Hollola show the lowest usage. As in all age groups, mobile internet use among those over 80 has increased annually—and relatively the fastest. In Riihimäki, Kerava, and Lempäälä, people over 80 appear exceptionally active, consuming 240–333 MB of mobile data per day. This is clearly more than the national average of 168 MB.
Average Usage Equals Long Video Viewing
What does Finland's average daily mobile data usage allow? Watching video on a smartphone for an hour may consume 700-3,000 MB depending on image quality, so 1,255 MB easily allows for extended viewing. Below is a list of indicative estimates of how much data various activities consume:
- Sending 50 emails without attachments: 1 MB
- Uploading a photo to social media: 3-8 MB
- Reading online newspapers for an hour: 100-200 MB
- Streaming music online for an hour: 100-200 MB
- Watching video on a smartphone for an hour: 700-3,000 MB
Figures are estimates of typical data consumption and vary significantly by user and service.
“As networks and devices evolve, services can also improve. This typically enhances the content experience, which in turn consumes more data. A better experience makes services more attractive. Even if you don’t spend more time on your smartphone, data consumption accelerates due to better image quality, as mobile screens have grown and become sharper. As a result, many tasks previously done on a computer are now handled on a phone,” Valtonen reminds.
How the Data Comparison Was Made
The comparison considered the average data consumption of DNA consumer customers only on billed subscriptions used in data-capable smartphones. Only subscriptions with the same owner and user were included. The comparison examines daily average usage per subscription from January to October 2025. It covered DNA customers living in Finland’s 50 largest municipalities. In addition, average data volumes were collected nationwide by age group. The comparison looked at total data volumes relative to the number of customers under selected criteria. It was impossible to identify individual network users or very small user groups.
Since the comparison was made between the 50 largest municipalities and nationwide averages, it cannot be ruled out that other municipalities might have even more distinctive user groups. The presented statistics are indicative, as limitations in data collection and possible recording errors in customer data may affect the figures. The comparison also does not include all residents of these municipalities if their billing address lists a locality that is not the official municipal name but, for example, a sub-area that was an independent municipality before a merger.
In the comparison, the averages of transferred data volumes have been used. Since customers’ data transfer amounts are not evenly distributed, average usage is typically higher than median usage. Most people therefore use less data than the average, while a small group uses a great deal. It’s also worth noting that the averages for all municipalities’ age groups may look unusual compared to age-specific figures because many young people may still have a phone plan paid by their parents, or many working-age individuals may have a company plan paid by their employer. However, the comparison only considers consumer plans owned by the user, which increases the weight of, for example, retired customers in the age group averages.
Finland’s 50 Largest Municipalities (June 2025): Helsinki, Espoo, Tampere, Vantaa, Oulu, Turku, Jyväskylä, Kuopio, Lahti, Pori, Joensuu, Kouvola, Lappeenranta, Vaasa, Hämeenlinna, Seinäjoki, Rovaniemi, Porvoo, Mikkeli, Salo, Kotka, Kokkola, Hyvinkää, Järvenpää, Lohja, Nurmijärvi, Tuusula, Kirkkonummi, Rauma, Kerava, Kaarina, Kajaani, Nokia, Kangasala, Ylöjärvi, Savonlinna, Vihti, Riihimäki, Raasepori, Raisio, Lempäälä, Imatra, Raahe, Sastamala, Sipoo, Hollola, Siilinjärvi, Pirkkala, Mäntsälä, Tornio.
Average daily data usage (MB) in mobile subscriptions by age group and municipality, 1–10/2025, for DNA’s billed mobile phone subscriptions across Finland’s 50 largest municipalities by population
|
Town/age |
18–29 |
30–39 |
40–49 |
50–59 |
60–69 |
70–79 |
over 80 |
All |
|
Helsinki |
2 751 |
1 794 |
1 473 |
1 357 |
845 |
418 |
192 |
1 377 |
|
Espoo |
2 720 |
1 680 |
1 412 |
1 430 |
804 |
354 |
197 |
1 369 |
|
Tampere |
2 783 |
1 841 |
1 503 |
1 252 |
730 |
379 |
163 |
1 448 |
|
Vantaa |
3 008 |
1 891 |
1 645 |
1 476 |
808 |
393 |
201 |
1 545 |
|
Oulu |
2 866 |
1 638 |
1 397 |
1 231 |
650 |
335 |
146 |
1 268 |
|
Turku |
2 683 |
1 834 |
1 604 |
1 340 |
748 |
355 |
171 |
1 364 |
|
Jyväskylä |
3 027 |
1 747 |
1 487 |
1 322 |
731 |
344 |
156 |
1 423 |
|
Kuopio |
2 928 |
1 641 |
1 392 |
1 195 |
631 |
342 |
152 |
1 185 |
|
Lahti |
3 057 |
1 741 |
1 458 |
1 213 |
667 |
315 |
145 |
1 146 |
|
Pori |
3 149 |
1 722 |
1 670 |
1 306 |
647 |
326 |
145 |
1 172 |
|
Joensuu |
3 354 |
1 798 |
1 597 |
1 273 |
757 |
384 |
147 |
1 414 |
|
Kouvola |
3 263 |
1 898 |
1 650 |
1 457 |
670 |
388 |
154 |
1 244 |
|
Lappeenranta |
3 200 |
1 797 |
1 527 |
1 335 |
721 |
370 |
148 |
1 320 |
|
Vaasa |
3 055 |
1 844 |
1 483 |
1 204 |
733 |
343 |
186 |
1 321 |
|
Hämeenlinna |
3 216 |
1 901 |
1 542 |
1 385 |
812 |
355 |
170 |
1 311 |
|
Seinäjoki |
3 036 |
1 669 |
1 487 |
1 186 |
590 |
341 |
125 |
1 233 |
|
Rovaniemi |
3 340 |
1 908 |
1 782 |
1 459 |
895 |
442 |
219 |
1 573 |
|
Porvoo |
3 019 |
1 841 |
1 593 |
1 344 |
871 |
387 |
147 |
1 296 |
|
Mikkeli |
3 305 |
1 741 |
1 620 |
1 365 |
699 |
335 |
193 |
1 214 |
|
Salo |
3 167 |
1 767 |
1 567 |
1 275 |
696 |
357 |
157 |
1 081 |
|
Kotka |
3 778 |
1 971 |
1 632 |
1 329 |
717 |
391 |
212 |
1 248 |
|
Kokkola |
3 075 |
1 744 |
1 627 |
1 276 |
536 |
339 |
207 |
920 |
|
Hyvinkää |
3 021 |
1 915 |
1 582 |
1 355 |
817 |
368 |
175 |
1 333 |
|
Järvenpää |
2 722 |
1 630 |
1 408 |
1 376 |
753 |
391 |
189 |
1 271 |
|
Lohja |
3 042 |
1 668 |
1 492 |
1 221 |
655 |
349 |
145 |
1 080 |
|
Nurmijärvi |
2 644 |
1 584 |
1 434 |
1 324 |
856 |
418 |
169 |
1 303 |
|
Tuusula |
2 630 |
1 562 |
1 472 |
1 410 |
817 |
385 |
202 |
1 292 |
|
Kirkkonummi |
2 891 |
1 608 |
1 349 |
1 383 |
823 |
365 |
116 |
1 303 |
|
Rauma |
3 041 |
1 786 |
1 531 |
1 163 |
660 |
313 |
155 |
1 052 |
|
Kerava |
3 070 |
1 846 |
1 618 |
1 367 |
745 |
434 |
276 |
1 409 |
|
Kaarina |
2 887 |
1 582 |
1 381 |
1 177 |
633 |
344 |
135 |
1 107 |
|
Kajaani |
3 427 |
1 896 |
1 564 |
1 224 |
656 |
377 |
175 |
1 224 |
|
Nokia |
2 737 |
1 525 |
1 457 |
1 291 |
697 |
364 |
154 |
1 153 |
|
Kangasala |
2 631 |
1 528 |
1 347 |
1 295 |
703 |
315 |
169 |
1 114 |
|
Ylöjärvi |
2 472 |
1 370 |
1 502 |
1 346 |
752 |
343 |
182 |
1 147 |
|
Savonlinna |
3 916 |
1 964 |
1 620 |
1 337 |
753 |
378 |
167 |
1 134 |
|
Vihti |
2 651 |
1 361 |
1 390 |
1 373 |
729 |
338 |
138 |
1 161 |
|
Riihimäki |
3 395 |
1 905 |
1 519 |
1 418 |
664 |
436 |
333 |
1 325 |
|
Raasepori |
2 848 |
1 891 |
1 526 |
1 346 |
653 |
330 |
175 |
1 128 |
|
Raisio |
3 046 |
1 529 |
1 454 |
1 071 |
609 |
285 |
164 |
1 001 |
|
Lempäälä |
2 678 |
1 427 |
1 372 |
1 322 |
668 |
339 |
240 |
1 169 |
|
Imatra |
3 742 |
2 289 |
1 779 |
1 429 |
932 |
415 |
187 |
1 397 |
|
Raahe |
4 015 |
2 107 |
1 741 |
1 370 |
629 |
323 |
150 |
1 200 |
|
Sastamala |
2 675 |
1 631 |
1 310 |
1 210 |
664 |
367 |
175 |
945 |
|
Sipoo |
2 706 |
1 545 |
1 463 |
1 473 |
777 |
376 |
195 |
1 282 |
|
Hollola |
2 656 |
1 478 |
1 432 |
1 177 |
674 |
293 |
162 |
997 |
|
Siilinjärvi |
2 861 |
1 561 |
1 393 |
1 147 |
670 |
323 |
144 |
1 062 |
|
Pirkkala |
3 046 |
1 366 |
1 241 |
1 458 |
606 |
335 |
112 |
1 233 |
|
Mäntsälä |
2 712 |
1 670 |
1 495 |
1 469 |
704 |
439 |
160 |
1 294 |
|
Tornio |
3 763 |
1 677 |
1 893 |
1 392 |
747 |
356 |
185 |
1 409 |
|
Whole Finland |
2 975 |
1 758 |
1 523 |
1 309 |
697 |
354 |
168 |
1 255 |
Additional information for media:
Mikko Valtonen, VP, Mobile Business, DNA Plc, tel. +358 (0) 44 044 5290, mikko.valtonen@dna.fi
DNA Corporate Communications, tel. +358 (0) 44 044 8000, communications@dna.fi
Images

DNA is one of the leading telecommunications companies in Finland. With you, we face forward to a safer and smarter future. We offer connections, services and devices for homes and workplaces, contributing to the digitalisation of society. Already for years, DNA customers have been among the world leaders in mobile data usage. DNA has about 3.7 million subscriptions in its fixed and mobile communications networks. The company has been awarded numerous times as an excellent employer and family-friendly workplace. In 2024, our total revenue was EUR 1,100 million and we employ about 1,600 people around Finland. DNA is a part of Telenor Group, a leading telecommunications company across the Nordics. More information: www.dna.fi, Facebook @DNA.fi, Instagram and Threads @dna_fi and LinkedIn @DNA-Oyj.
Alternative languages
Subscribe to releases from DNA Oyj
Subscribe to all the latest releases from DNA Oyj by registering your e-mail address below. You can unsubscribe at any time.
Latest releases from DNA Oyj
DNA Oyj:n huhti–kesäkuun 2026 liiketoimintakatsaus: Tasainen kehitys jatkui kireässä markkinatilanteessa16.7.2026 08:30:00 EEST | Tiedote
Kireään kilpailutilanteeseen nähden kuluvan vuoden toinen neljännes oli DNA:lle taloudellisesti varsin hyvä. Huhti–kesäkuussa liikevaihto pysyi liki samalla tasolla vuodentakaiseen ajanjaksoon verrattuna. Käyttökate kasvoi, erityisesti kun vertailussa huomioidaan DNA:n IoT-liiketoiminnan siirto toiseen Telenorin konserniyhtiöön kuluvan vuoden alussa. Kiinteiden laajakaistaliittymien ja matkaviestinverkon liittymien määrät kasvoivat, mutta niiden keskilaskutus hieman laski.
DNA Plc’s Business Review for April–June 2026: Steady development continued in a highly competitive market environment16.7.2026 08:30:00 EEST | Press release
Considering the intense competitive landscape, the second quarter of the current year was financially quite strong for DNA. During April–June, revenue remained nearly at the same level as in the corresponding period last year. EBITDA increased, particularly when taking into account the transfer of DNA’s IoT business to another Telenor Group company at the beginning of the year. The number of fixed broadband and mobile network subscriptions increased, while their average revenue per user declined slightly.
Etätyöt ja suoratoisto seuraavat myös mökille – näin korjaat takkuilevan mökkinetin14.7.2026 14:28:47 EEST | Tiedote
Mökkikausi on monelle myös etätyö-, suoratoisto- ja yhteydenpitokautta, jolloin toimivan nettiyhteyden merkitys korostuu. DNA:n tuoreen Digitaalinen elämä -tutkimuksen mukaan 21 % suomalaisista on kohdannut haasteita nettiyhteytensä kanssa. Vaikka ongelmia esiintyy yleisimmin kodin internetyhteyksissä, myös mökeillä yhteyden hitaus tai toimimattomuus aiheuttaa päänvaivaa osalle käyttäjistä. Moni ongelmista ratkeaa kuitenkin jo yksinkertaisilla toimenpiteillä, joista helpoin on modeemin uudelleenkäynnistys.
Remote work and streaming follow people also to the summer cottage – here’s how to fix a slow cottage internet connection14.7.2026 14:28:47 EEST | Press release
For many, the summer cottage season is also a season of remote work, streaming and staying connected with loved ones, which makes the importance of a functioning internet connection all the more pronounced. According to DNA’s latest Digital Life survey, 21% of Finns have encountered challenges with their internet connection. Although problems occur most commonly with home internet connections, slow or non-functioning connections at summer cottages also cause headaches for some users. However, many of these problems can be solved with simple measures, the easiest of which is restarting the modem.
DNA purkaa käytöstä poistuneita puhelinpylväitä ja -johtoja Päijät-Hämeessä3.7.2026 11:00:00 EEST | Tiedote
DNA poistaa Päijät-Hämeessä vanhan kupariverkon käytöstä poistuneita puhelinpylväitä ja ilmajohtoja vuosien 2026–2027 aikana. Osa puhelinpylväistä ja -linjoista sijaitsee yksityisillä mailla ja pihoilla. Päijät-Hämeessä purkutyöt ovat parhaillaan käynnissä muun muassa Hartolan, Sysmän, Asikkalan ja Nastolan alueilla. Vuonna 2027 purkutyöt jatkuvat Lahdessa, Orimattilassa ja Kärkölässä.
In our pressroom you can read all our latest releases, find our press contacts, images, documents and other relevant information about us.
Visit our pressroom